Posts

Showing posts from 2024

Two subtle problems with over-representation analysis

Image
Over-representation analysis is a helpful and really frequently used technique for understanding trends from omics data and gene lists more generally. Just to demonstrate this, I tabulated the number of citations of some of the most popular web tools and packages, which reaches a massive 191k citations! But if you have used some of these tools, you will notice that they yield subtly different results. We were curiuous about that and ran a whole bunch of investigations into the internal workings of these tools, in particular clusterProfiler. We identified two subtle problems with clusterProfiler, which we unpack in detail in our new publication , but here I will give you a quick overview. Problem #1: The background problem The first one we call the “background problem,” because it involves the software eliminating large numbers of genes from the background list if they are not annotated as belonging to any category. This results in removing a large number of unannotated genes from the b

Screen for mycoplasma contamination in DNA-seq and RNA-seq data: Part 2

Image
If you're culturing cells, avoiding contamination is an extremely important priority. Mycoplasma are common contaminant that can change the behaviour of cells and don't cause any obvious morphological changes, so routine testing is key. As bioinformaticians we should be incorporating myco screening into all our workflows, but the available tools haven't been that great. Even the shell script I wrote in a previous blog post isn't that great. It suffers from a few problems in miscounting reads, usability and leaving many files in the working directory. So it is high time for a refresh. With this refresh, the idea was to make a command line tool that folks could easily incorporate into their workflows, would process single- and paired-end data, be quick and be concise in its output. The result is `contam`. To give you an idea of what it can do, here is the help page: contam is a script for the quantification of contaminant sequences in Illumina short read sequence data i

Need to build and run a Docker image but don't have root access? No problem with Apptainer!

Image
My group is moving towards a working paradigm where each project has a Docker image. This helps keep control of the environments for each project, as you know that operating systems and programming languages like R and Python undergo regular upgrades, which are mostly undesirable for long running data analytics projects. For example in the field of biomedical genomics, some projects can take up to 10 years between initiation and final publication, so having a stable and portable computing environment is crucial. While this solution is fantastic if you have a workstation where you have free reign to use root/sudo permissions, many data analysts are restricted to using shared computing resources without root. There are some ways to mitigate these restrictions. One approach is to make a Docker image on another computer and use Singularity  or Udocker  to pull and convert it to be run by non-root user. But sometimes, users don't have access to another computer to build these images. Op

Weird multi-threaded behaviour of R/Bioconductor under Docker

Image
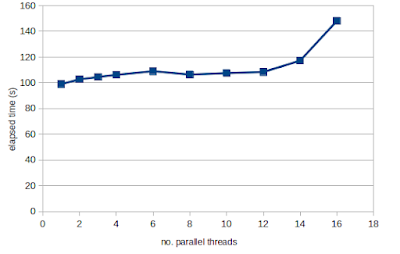
As I was running some R code under Docker code recently, I noticed that processes that should be single threaded, were using all available threads. And this behaviour was different between R on a native Linux machine as compared to Docker.  A search of the forums found that this is due to the configuraiton of the BLAS system dependancy on those Docker images, which is set to use all available threads for matrix operations. This configuration sounds like a good idea at first because dedicating more threads to a problem should speed up the execution. But realise that parallel processing incurs some overhead to coordinate the sub tasks and communicate the data to/from daughter threads. This means that you rarely achieve linear speedup the more threads you add. Typically what happens is that parallelisation has a sweetspot where the first 5-10 threads provide some speed-up, but beyond that there is either no improvement in speed or that adding additional threads actually makes the code sl

Stress test RAM annually

Image
TLDR: System memory can go bad. Use `memtester` on your Linux system annually to spot any problems early. Now the long story... In bioinformatics, we process a lot of data and conduct a lot of analysis. We use a range of devices from laptops to desktop workstations and remote servers and cloud. One particular desktop workstation of mine has been showing intermittent freezing and other problems, so I spent a bit of time trying to diagnose the issue. It is based on the AMD Threadripper 2990WX 32 Core CPU with 8x 16GB DDR4 modules, and we have been using it to process thousands of RNA sequencing datasets for the DEE2 project. It has been working at maximum capacity for about 6 years. Symptoms it had were sudden shutdowns and freezing. I checked the CPU temperatures (using the `stress` command) and it was high, in the 90 °C. range which was odd given it was water cooled with an all in one system. I removed the block to inspect the thermal paste, and I found that the block did not appear t

Pathway analysis - speed of FGSEA versus Mitch

Image
FGSEA is among the most used pathway enrichment tools due to its speed and straightforward design. While doing a comparison of different enrichment tools recently, I compared it against a tool called "mitch" and I noticed something interesting. Mitch was actually faster than fgsea. This is strange, because my own tests from 2020 published in BMC Bioinformatics showed that fgsea was >10x faster (fgsea version 1.11.1) (Fig 1). Fig 1. Tests conducted in 2020 show FGSEA is 10x faster than mitch. As emphasised in our 2020 paper, speed wasn't the main priority for our software. We were focused on enabling multi-dimensional analysis. But given this curious observation, I did a systematic test of speed of fgsea and mitch using a real dataset to try and understand whether fgsea underwent some code changes that made it slower. The codes for my work are on GitHub , and I used the bioconductor docker images  to repeat this across Bioconductor versions from 3-11 onwards. Before 3.1

Adding a Docker image to your R bioinformatics project to improve reproducibility

Image
I have gotten into the habit of making Docker images for each of my projects, which is helpful if these projects are large, and span over multiple years. Long-running projects are a headache for bioinformaticians because software like R has significant updates each year and we want to keep our machines running the most up to date software with recent bug fixes, features and new packages.  Docker images also help in making the research more reproducible for others who are interested in taking a deeper dive into the research materials. This helps auditability and could even help in improving research quality through better transparency. That said, still it is a bit tricky to achieve, so I thought I would write walk through on how I do it with an R workflow. Step 0: install docker on a linux system On Ubuntu you can use: sudo apt install docker.io Other OSs will vary. Step 1: Write your R Markdown script You probably have a workflow that you've been working on which works for your cur

The power of enrichment analysis for epigenetics: Application to schizophrenia

Image
As regular readers of GenomeSpot will know, we have adopted the mitch package to enable enrichment analysis of methylation array data, as shown in our recent pre-print . You might be thinking that enrichment analysis of methylation data has existed for a long time, so why do we need a new approach? Well the answer to that is the current methods suffer one of the critical problems: (1) they use over-representation analysis (ORA), which has very low sensitivity, or (2) they do not distinguish between up- and down- directions of methylation change.  (1) is a problem because ORA relies on binary classification of probes or genes into differential or not, whereas in reality probes and genes are spread on a distribution of differential-ness. This makes ORA easy to compute, but leads to low sensitivity. In serious cases, the (arbitrary) threshold used for selection of differential probes means that very few probes are present in the foreground. (2) is a problem because gene and pathways are t

Yes, mitch can be used for pathway analysis of Methylation array data

Image
In 2020, Dr Antony Kaspi and I published a method called "mitch" [1] which is like GSEA, but was specifically designed for multi-contrast analysis, and based on rank-MANOVA statistics inspired by a 2012 paper by Cox and Mann. Mitch worked well for various types of omics data downstream of commonly used differential abundance tools like DESeq2, edgeR, DiffBind, etc, but we didn't consider at the time how mitch could be applied to microarray data.  You might think that microarrays are outdated, but they are still used extensively for epigenome-wide association studies (EWASs), which are frequently used to understand disease processes and to identify biomarkers of disease. To demonstrate, there are 1536 publicly available methylation array studies on NCBI GEO, and probably many more thousands that are restricted access. The tools available for pathway analysis of methylation array data are a bit limited. There's an over-representation method that take into consideration

Don't use KEGG!!!

Image
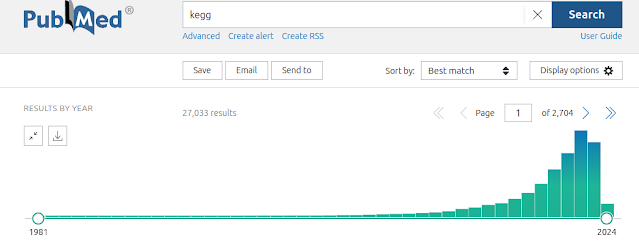
KEGG is the Kyoto Encyclopedia of Genes and Genomes, a compendium of gene functional annotations which are commonly used for pathway enrichment analysis. KEGG has been around since 1997 (PMID: 9390290) but in 2000, as the draft human genome sequence was released, KEGG became a key database involved in the curation of literature data to catalog the function of all human genes, many of which were newly sequenced and previously uncharacterised. This invigorated interest in KEGG is demonstrated by one of their articles in 2000 (PMID: 10592173) accruing 24,236 citations according to Dimensions , 1270 fold higher than other articles from that time. A PubMed search using "KEGG" keyword shows 27,033 results, with matches in abstracts alone and the tragectory is increasing at a rapid rate. Despite the popularity of this tool, I'm urging you not to use it for your research. Here I will lay out the reasons. 1. It isn't comprehensive I did an analysis of KEGG and other pathway se

Example blast workflow (nucleotide)

Image
BLAST is a stalwart in the bioinformatics space. I've used it in multiple contexts and it is a good way to introduce students to bioinformatics principles and the process of pipeline development. Although there is a web interface, it is still good to use it locally if you need to run a large number of queries. As my group needed to use BLAST again this week, I thought I'd share a small example script which I shared with my Masters research students just getting into bioinformatics. The script (shown below) downloads the E. coli gene coding sequences and then extracts by random a few individual sequences. These undergo random mutagenesis and then we can use the mutated sequences as a query to find the original gene with BLAST. The output format is tabular which suits downstream large scale data analysis. The script also includes steps for generating the blast index. The script is uploaded as a gist here . It requires prerequesites: sudo apt install  ncbi-blast+ emboss unwrap_fas