Posts

Showing posts from 2014

2014 Wrap-Up

Image
The year has gone so fast! Lets go through some of the major points of 2014 and predict what 2015 has in store. Sequencing hardware It began with announcements from Illumina of the HiSeqX10 as well as the release of the NextSeq500. Later, X-10 technology was included in V4 HiSeq2500 kits resulting in a substantial increase in sequence output from that instrument. There was also the announcement of the NeoPrep automated library preparation system that will be officially released in the 1st half of 2015. NeoPrep looks like an attempt to use microfluidics to perform generate libraries; if this is successful, it would be a major advance in reducing bottlenecks in sample preparation. Microfluidics are also able to reduce the volumes of reagents required, making the process cheaper. In addition, labour costs per library will be drastically reduced given that automation will be commonplace for routine protocols. Regarding 3rd gen platforms, we saw some mixed reviews from Oxford Nanopore

Interspecies gene name conversion

Image
In this post, I'll provide a step-by-step guide to perform interspecies gene name conversion of gene expression data. This is a necessary step in the comparison of profiling data from two different experiments with different species (human and mouse), and allows us to use extensive human-centric gene set libraries in MSigDB when analysing non-human mammalian profiling data (such as mouse). I performed GEO2R analysis of mouse expression data ( GSE30192 ) to analyse the effect of azacitidine on mouse C2C12 myoblasts. The data looks like this: "ID" "adj.P.Val" "P.Value" "t" "B" "logFC" "Gene.symbol" "Gene.title" "1420647_a_at" "0.000346" "2.24e-08" "56.073665" "8.699524" "6.9755573" "Krt8" "keratin 8" "1423327_at" "0.000346" "2.32e-08" "55.685912" "8.686447" &q

User friendly RNA-seq differential expression analysis with Degust

Image
There is a need to make bioinformatics tools more user friendly and accessible to a wider audience. We have seen that Galaxy , GEO2R ,  Genevestigator and GenePattern  have each developed a huge following in the molecular biology community, and this trend will continue with introduction of new RNA-seq analysis tools. Previously, I posted about differential gene expression analysis of RNA-seq performed by the DEB  online tool. In this post, I introduce Degust , an online app to analyse gene expression count data and determine which genes are differentially expressed. Degust was written by David R. Powell ( @d_r_powell ) and was Supported by Victorian Bioinformatics Consortium, Monash University and VLSCI's Life Sciences Computation Centre . In this test, I'll be using the azacitidine mRNA-seq data set that I have previously analysed.  To make the count matrix, I used featureCounts. First step in the process is to your RNA-seq count data. It can be done in tab or comma se

microRNA aligners compared

Image
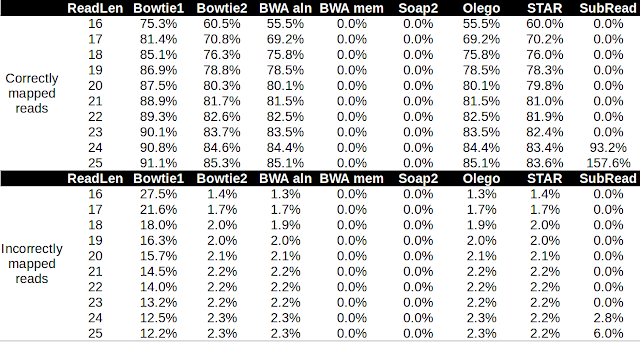
Alignment of microRNA to the genome poses a particular challenge because the reads are short, and some microRNAs are nearly identical. Moreover, microRNAs themselves are subject to RNA editing ( adenine-to-inosine conversion , non-templated base addition ) and normal sequencing error rates. In this post, I'm going to test the performance of several aligners in aligning microRNA reads to the Arabidopsis genome.  I downloaded the Arabidopsis genome from  Ensembl plant  and the latest  miRbase release version 21 . I used bowtie2 to align the 325 full-length hairpin transcripts to the Arabidopsis genome. I generated pseudo microRNA reads that uniformly cover the hairpin transcript at a range of lengths from 16 nt to 25 nt. I then aligned the reads to the Arabidopsis genome using these different aligners with the default settings. I then used bedtools and awk to count the correctly and incorrectly mapped reads at a mapQ threshold of 10.  Table 1. Performance of several aligne

DNA aligner accuracy: BWA, Bowtie, Soap and SubRead tested with simulated reads

Image
In the past few posts, we've looked at RNA-seq aligner performance in terms of accuracy and speed. In this post, I'll take a look at the accuracy of DNA aligners using simulated reads. The first step is to download the genome of interest. I'm using Arabidopsis as its pretty small and good for quick benchmarking. I downloaded the genome from Ensembl plant ftp site ( link ). Next step was to generate simulated reads that uniformly cover the genome at user-selected length and intervals. I couldn't find any previously made simulators to do exactly that, so I chained together some awk and bedtools commands (code at the bottom of the post) to generate the reads. I generated pseudo reads of 50, 100 & 200 bp in length at 10 bp intervals and output them in fasta format. Here is an example. >1-0-50 CCCTAAACCCTAAACCCTAAACCCTAAACCTCTGAATCCTTAATCCCTAA >1-10-60 TAAACCCTAAACCCTAAACCTCTGAATCCTTAATCCCTAAATCCCTAAAT >1-20-70 ACCCTAAACCTCTGAATCCTTAATCCCTAAATCCCTAAAT

Geneclouds: unconventional genetics data visualisation

Image
You have probably seen word clouds before - but have you tried with gene expression data? I used the following bash script to process a DESeq spreadsheet from a a previous RNA-seq  post . The script extracts the gene name and p-value of the genes with differential expression. I used awk to separate the up and down regulated genes into different files. The score used to inform the font size is the exponent of the p-value. So this works best when there are a lot of statistically significant genes p-values. The data looks like this: AC011899.9:60 CAMK1D:54 GNG4:44 CGNL1:41 APCDD1:37 HSD11B1:33 Now go to the "advanced" tab of the Wordle page  and paste in the data. Experiment, with the colours, layouts and be sure to increase the "maximum words" to get a real appreciation for the number of changes in your experiment. Here is an example I made using both the up and down regulated gene sets showing the effect of azacytidine on AML3 cells. The result is pretty

RNA-seq aligner accuracy tested with simulated reads

Image
In the previous post we looked at how choice of RNA-seq aligner influenced results. In this post, we'll use simulated reads to empirically determine the accuracy of OLego, STAR, SubJunc and SubRead. I made a pretty basic bash script (see below) to generate fasta format reads at uniform intervals along the length of transcripts without errors. The user can readily change the read length and the interval between read initiation. The script created 11.3 million 100 bp reads in 9 minutes so it is OK in terms of speed. It is designed to take Ensembl cDNA files as an input and has been tested on human  and  Arabidopsis . Here is what the generated reads look like >AT2G01210.1:gene:AT2G01210_197863 CGTCAGCTTTCGTTCTGGGGAAGAGCGGAATCGGAATTGTCTACAAAGTG >AT2G01210.1:gene:AT2G01210_197864 GTTCTAGAGAACGGGCTCACACTGGCCGTACGGAGATTGGGTGAAGGAGG >AT2G01210.1:gene:AT2G01210_197865 GTCTCAGAGATTCAAGGAGTTTCAGACAGAAGTTGAAGCCATAGGGAAAC >AT2G01210.1:gene:AT2G01210_197866 TAAAACATCCTAA

Forty-Four and Two

Image
If you like science, you will love Forty-Four and Two . A new blog that delves into genetics and molecular biology for the wider audience. His latest post is an impressive poster describing some data we published together earlier this year in CMLS . Keep up the good work!

RNA-seq aligners: Subread, STAR, HPG aligner and Olego | PART 2

Image
In the previous post , I compared the speed of several RNA aligners. In this post, we'll take a closer look at the results generated by these different aligners; Subread/Subjunc , STAR , HPG aligner and Olego . In addition, we will use BWA MEM as an example of what happens when you use a DNA aligner to analyse RNA-seq. For the test, we've been using 101 bp  Arabidopsis mRNA-seq data from GEO accession  GSE42968 . For simplicity, I use only the forward read in the paired-end dataset. I used fastx-toolkit to remove low quality bases from the 3' end (base qual threshold of 20). One of the simplest ways to assess the quality of an alignment is to determine the proportion of reads that are mapped to the genome and the proportion that map to exons. After the aligners did their work, I used featureCounts to quantify the number of aligned reads with a mapping quality >10. Here is the data for the first sample in the series, SRR634969 which contained 14.5 million reads.