Posts

Showing posts with the label microarray

Yes, mitch can be used for pathway analysis of Methylation array data

Image
In 2020, Dr Antony Kaspi and I published a method called "mitch" [1] which is like GSEA, but was specifically designed for multi-contrast analysis, and based on rank-MANOVA statistics inspired by a 2012 paper by Cox and Mann. Mitch worked well for various types of omics data downstream of commonly used differential abundance tools like DESeq2, edgeR, DiffBind, etc, but we didn't consider at the time how mitch could be applied to microarray data.  You might think that microarrays are outdated, but they are still used extensively for epigenome-wide association studies (EWASs), which are frequently used to understand disease processes and to identify biomarkers of disease. To demonstrate, there are 1536 publicly available methylation array studies on NCBI GEO, and probably many more thousands that are restricted access. The tools available for pathway analysis of methylation array data are a bit limited. There's an over-representation method that take into consideration ...

Has RNA-seq overtaken microarrays?

Image
We know RNA-seq has a number of advantages over array based analyses, but is RNA-seq taking over in terms of number of datasets published? I got curious and thought I'd investigate with some PubMed searches. I searched for "RNA-seq" and "microarray" and downloaded the CSV file which summarises the number of citations per year. As a type of control, I also searched "gene expression". I divided the yearly "RNA-seq" and "Microarray" citation counts by the "Gene expression" counts then multiplied by 1000 to give the numbers seen below. You can see that microarray is still more frequent in PubMed as compared to RNA-seq, but the gap is getting much narrower and the cross will likely occur in the next two years. Next, I will look at the rate of GEO data deposition. (Updates soon)

Comparing expression profiles

Image
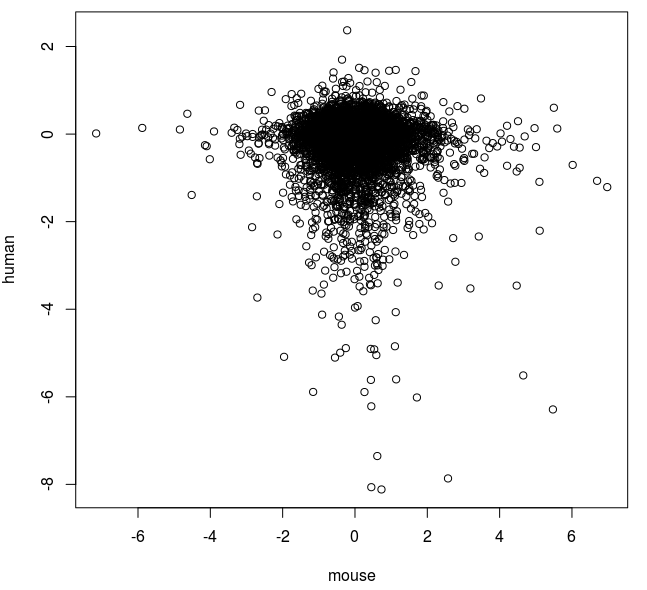
One of the most common tasks in gene expression analysis is to compare different profiling experiments. There are three main strategies: Compare all data points - using a correlation analysis Compare sets of up and down-regulated genes - using a binomial or Fisher exact test Compare sets of genes within a profile - such as GSEA test In this post, I'll describe how correlation analysis is used between expression data sets of all detected genes. Merging data sets No matter what type of correlation used, the profiling data sets need to be merged. This means selecting a field that can the datasets can be merged on. This could be a array probe ID, gene accession number or gene symbol as in this case. I will compare gene expression profiles from two experiments (azacitidine in human and mouse cells). The human gene profile was generated by RNA-seq and the mouse data set by microarray. The human data is currently in CSV format from Degust  and looks like this: gene,c,aza,F...