The power of enrichment analysis for epigenetics: Application to schizophrenia
As regular readers of GenomeSpot will know, we have adopted the mitch package to enable enrichment analysis of methylation array data, as shown in our recent pre-print. You might be thinking that enrichment analysis of methylation data has existed for a long time, so why do we need a new approach? Well the answer to that is the current methods suffer one of the critical problems: (1) they use over-representation analysis (ORA), which has very low sensitivity, or (2) they do not distinguish between up- and down- directions of methylation change.
(1) is a problem because ORA relies on binary classification of probes or genes into differential or not, whereas in reality probes and genes are spread on a distribution of differential-ness. This makes ORA easy to compute, but leads to low sensitivity. In serious cases, the (arbitrary) threshold used for selection of differential probes means that very few probes are present in the foreground. (2) is a problem because gene and pathways are typically positively correlated, meaning they will appear as either up- or down-regulated but when you combine them, the overall signal is diminished, further reducing sensitivity.
As our method is relatively new, it has yet to be widely adopted, so I have been actively looking for newly published epigenetic studies where we can test it out. So when I saw this very well conducted study on blood based methylation marks of schizophrenia, I wanted to apply our pipeline to see if we could enhance the current understanding of epigenetic changes in this mental disorder.
In this study, they looked at a number of measures correlated with methylation including age of onset, effect of clozapine, cognitive function, and severity of symptoms using the GAF score. For this blog post I will only focus on symptom severity. In this study, the MethylationEPIC BeadChip (Illumina) was used to look for methylation differences associated with GAF scores in n=367 participants. Interestingly in the study, none of the probes reached significance at 5% FDR, the top probes only reached a nominal p = 7.18 × 10⁻⁸. And at their less conservative significance threshold of p< 6.72 × 10⁻⁵, there were 162 probes located on 136 genes identified. They conducted ORA based GO enrichment analysis with the Toppfun suite which revealed terms including including neuron projection, neurogenesis, and postsynapse (FDR < 0.05). Overall, they identified 57 significant pathways that were enriched by they did not specify in which direction, nor did they specify an enrichment score. Moreover they didn't describe a background gene list, which could invalidate enrichment results according to our previous study.
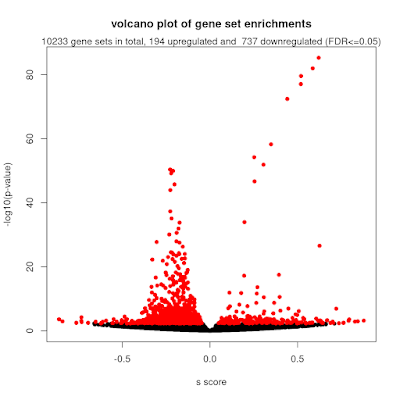
To make this work with the mitch pipeline, we used the observed effect size estimate as the input. As each gene has many annotated probes, we take the mean value to represent the gene's overall differential methylation score. I also flipped the sign of the effect size to indicate that higher numbers represent increased methylation that occurs with increasing symptom severity (this is standard practice in biomedicine). Using this together with GO sets, we got some really interesting results. From the 10233 gene sets with 5 or more members, 194 showed higher methylation and 737 showed lower methylation. There were several GO sets with absolute enrichment scores (s) > 0.5 which indicates very strong changes of a gene set.
- Full analysis reports: https://ziemann-lab.net/public/schizophrenia/
- Reproducible code: https://github.com/markziemann/schizophrenia


