Posts

Showing posts from 2020

DEE2 project update October 2020
Image
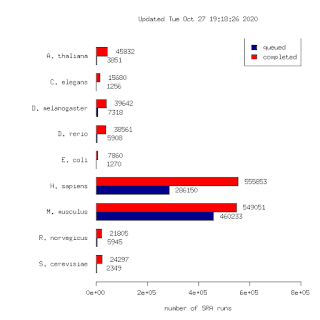
Bit of a thread for some updates to the DEE2 data set. It's a resource of uniformly processed RNA-seq data free to use under a permissive GPL3 licence. Find it at http://dee2.io Yesterday a batch of 117k human runs were uploaded. This brings the total number of runs to 1,298,581. To my knowledge this is the largest such data set in the world. This is 10x larger than our first release in 2015! (125k runs) The number of SRA projects with completed data analysis bundles is 32692  Accesible here: http://dee2.io/huge/ The getDEE2 package is the recommended way to access this data if you are familiar with R. You can access individual runs or enrire data bundles with the various functions. The pkg is part of the latest BioC release out today https://www.bioconductor.org/packages/devel/bioc/html/getDEE2.html The button for redirecting DEE2 data directly to Degust is broken and we are looking for a fix. For now  you will need to download the data to the disk and upload to the Degust webpage

EdgeR or DESeq2? Comparing the performance of differential expression tools

Image
It seems like this discussion comes up a lot. Choosing a differential expression (DE) tool could change the results and conclusions of studies. How much depends on the strength of the data. Indeed this has been coveres by others already ( here , here ). In this post I will compare these tools for a particular dataset that highlights the different ways these algorithms perform. So you can try it out at home, I've uploaded the code for this to GitHub here . To get it to work, clone the repository and open the Rmarkdown (.Rmd) file in Rstudio. You will need to install Bioconductor packages edgeR , DESeq2 and the CRAN package eulerr (for the nifty venn diagrams). Once that's done you can start working with the Rmd file. For an introduction to Rmd  read on here . Suffice to say that it's the most convenient way to generate a data report that includes code, results and descriptive text for background information, interpretation, references and the rest. To create the report in

Installing R-4.0 on Ubuntu 18.04 painlessly

There are some great instructions here but there are a few gotchas to be aware of. Follow these instructions first, and it will make the process a LOT easier: 1. Make sure you have these dependancies installed. If you don't, you're going to have trouble installing any R packages like R curl, tidyverse, devtools, etc sudo apt install libssl-dev libcurl4-openssl-dev libxml2-dev 2. Remove any existing R install. sudo apt remove r-base* --purge 3. Remove any remaining packages. It's better to install them "fresh". They will be in locations like /home/user/R/R-3.6.6 and /usr/lib/R/library/ 4. Remove any existing entry for R in the etc/apt/sources.list to install an older R version. sudo nano /etc/apt/sources.list For example you might have something like this: deb https://cloud.r-project.org/bin/linux/ubuntu bionic-cran35/ 5. Then follow the DigitalOcean instructions here  and you should be set up in just a few minutes.

Mitch: An R package for Multi-Contrast Gene Set Enrichment Analysis

Image
Gene set enrichment is one of the key methods in the understanding of gene expression patterns. As omics are becoming more widely used, large experiments are common and include not just one contrast (control vs case), but perhaps many contrasts (eg: healthy, disease, treatment 1, treatment 2, etc). Previously, as part of an epigenetics/epigenomics lab we were looking at ways to integrate different types of omics profiling such as RNA expression, histone acetylation and DNA methylation. We stumbled across a paper that proposed the use of multivariate ANOVA on ranks ( Cox & Mann 2012 ) to identify gene sets that exhibited enrichment in one or more contrasts. We thought this could be a simple way to identify gene set enrichments when looking at multiple contrasts without the need to run GSEA multiple times and summarise the results. The tool described in Cox & Mann (2012) is written for the Perseus suite which works for Windows. We saw there was no similar implementation in R so