Posts

Showing posts from January, 2015

SRA toolkit tips and workarounds

Image
The Short Read Archive (SRA)  is the main repository for next generation sequencing (NGS) raw data. Considering the sheer rate at which NGS is generated (and accelerating), the team at NCBI should be congratulated for providing this service to the scientific community. Take a look at the growth of SRA: Growth of SRA data (http://www.ncbi.nlm.nih.gov/Traces/sra/i/g.png) SRA however doesn't provide directly the fastq files that we commonly work with, they prefer the .sra archive that require specialised software ( sra-toolkit ) to extract. Sra-toolkit has been described as buggy and painful; and I've had my frustrations with it. In this post, I'll share some of my best tips sra-toolkit tips that I've found. Get the right version of the software and configure it When downloading, make sure you download the newest version from the NCBI website ( link ). Don't download it from GitHub or from Ubuntu software centre (or apt-get), as it will probably be an older

Generate an RNA-seq count matrix with featureCounts

Featurecounts is the fastest read summarization tool currently out there and has some great features which make it superior to HTSeq or Bedtools multicov. FeatureCounts takes GTF files as an annotation. This can be downloaded from the Ensembl FTP site . Make sure that the GTF version matches the genome that you aligned to. FeatureCounts it also smart enough to recognise and correctly process SAM and BAM alignment files. Here is a script to generate a gene-wise matrix from all BAM files in a directory. #!/bin/bash #Generate RNA-seq matrix #Set parameters GTF=/path/to/Mus_musculus.GRCm38.78.gtf EXPTNAME=mouse_rna CPUS=8 MAPQ=10 GENEMX=${EXPTNAME }_genes.mx #Make the gene-wise matrix featureCounts -Q $MAPQ -T $CPUS -a $GTF -o /dev/stdout *bam \ | cut -f1,7- | sed 1d > $GENEMX The data are now ready to analyse with your favourite statistical package (DESeq, EdgeR, Voom/Limma, etc). Consider attaching the gene name to give the data more relevance. To do that, first

Comparing expression profiles

Image
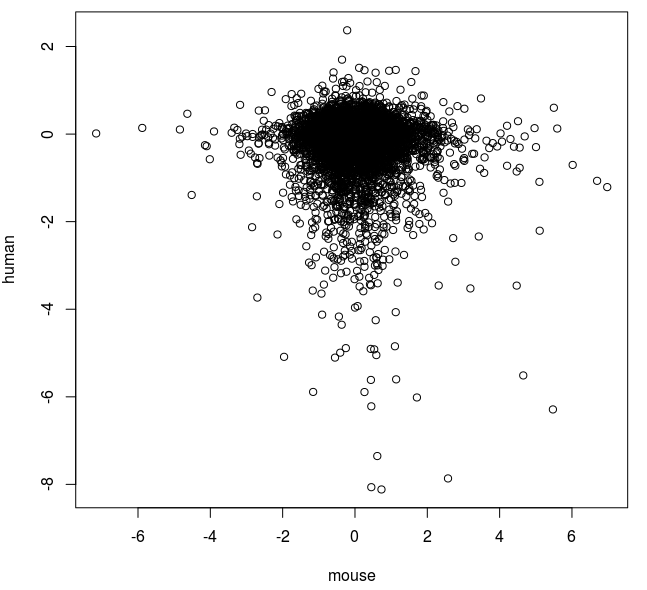
One of the most common tasks in gene expression analysis is to compare different profiling experiments. There are three main strategies: Compare all data points - using a correlation analysis Compare sets of up and down-regulated genes - using a binomial or Fisher exact test Compare sets of genes within a profile - such as GSEA test In this post, I'll describe how correlation analysis is used between expression data sets of all detected genes. Merging data sets No matter what type of correlation used, the profiling data sets need to be merged. This means selecting a field that can the datasets can be merged on. This could be a array probe ID, gene accession number or gene symbol as in this case. I will compare gene expression profiles from two experiments (azacitidine in human and mouse cells). The human gene profile was generated by RNA-seq and the mouse data set by microarray. The human data is currently in CSV format from Degust  and looks like this: gene,c,aza,F

How to generate a rank file from gene expression data

Turning a gene expression profile into a ranked list is useful for comparing with other profiling data sets as well as an input for preranked GSEA analysis ( example here ). In this post, I describe a simple bash script called rnkgen.sh that can take gene expression data from a range of sources, such as edgeR, DESeq, GEO2R, etc., and generate a ranked list of genes from most up-expressed to most down-expressed based on the p-value. #!/bin/bash #rnkgen.sh converts a differential gene expression spreadsheet (XLS) into a rank file (RNK) #Specify the input file XLS=$1 #Specify the gene ID column ID=$2 #Specify the fold change value column FC=$3 #Specify the raw p-value column P=$4 sed 1d $XLS | tr -d '"' \ | awk -v I=$ID -v F=$FC -v P=$P '{FS="\t"} $I!="" {print $I, $F, $P}' \ | awk '$2!="NA" && $3!="NA"' \ | awk '{s=1} $2<0{s=-1} {print $1"\t"s*-1*log($3)/log(10)}' \ | awk