Data analysis step 9: Leverage ENCODE data for enhanced pathway analysis
So far in this series of posts we've analysed the effect of azacitidine on AML3 cell gene expression using publicly available RNA-seq data. Our pathway analysis showed many interesting trends, but unravelling all the different mechanisms from this point can be really hard. In order to identify the major players at the chromatin level, it can be useful to integrate transcription factor binding data and see whether targets of a particular transcription factor are differentially regulated in a pathway analysis. The problem with this analysis in the past was that ChIP-seq datasets were in varying formats on GEO and processing these into a standardised format would be too time consuming. With the advent of the ENCODE Project, there is now a large body of transcription factor binding data in a uniform format (link), that is being mined in many creative ways. In our group, we used this approach extensively (here, here and here).
In this post, we will mine ENCODE transcription factor binding site (TFBS) data to determine TF-target gene interactions and process these into gene sets for pathway analysis in GSEA.
Our general approach will be the following:
Execute the following script to download the contents files and then download the TFBS peak files. These are based upon the hg19 human genome build. The peak files will appear in a folder called "peakfiles". At the time of writing there are 1340 peak files. You may need to install curl.
In this post, we will mine ENCODE transcription factor binding site (TFBS) data to determine TF-target gene interactions and process these into gene sets for pathway analysis in GSEA.
Our general approach will be the following:
- Download a bed file of all promoters (or prepare one from a gtf file)
- Download ENCODE TFBS data in bed format
- Intersect TFBS sites to promoters using bedtools
- Pick the top 1000 target genes for each TFBS data set
- Perform pathway analysis using the new gene sets
Download TFBS data
ENCODE TFBS data is organised into 5 subdirectories. Each of these contains a files.txt outlining the contents. Create a text file called "URL.txt" containing the following:
http://hgdownload.cse.ucsc.edu/goldenPath/hg19/encodeDCC/wgEncodeHaibTfbs/

http://hgdownload.cse.ucsc.edu/goldenPath/hg19/encodeDCC/wgEncodeSydhTfbs/

http://hgdownload.cse.ucsc.edu/goldenPath/hg19/encodeDCC/wgEncodeUchicagoTfbs/

http://hgdownload.cse.ucsc.edu/goldenPath/hg19/encodeDCC/wgEncodeOpenChromChip/

http://hgdownload.cse.ucsc.edu/goldenPath/hg19/encodeDCC/wgEncodeUwTfbs/
#!/bin/bash


URLS=URL.txt

TFBS_URLS=files_TFBS_URLs.txt
for URL in `cat $URLS`

do

URL2=`echo $URL | tr '/' '+'`

LAB=`echo $URL | tr '/' '_' | sed 's/wgEncode/@/' | cut -d '@' -f2-`
echo $LAB
wget --quiet $URL/files.txt

mv files.txt files_${LAB}TFBS.txt

curl $URL/files.txt | grep Peak.gz | cut -f1 \

| sed "s/^/${URL2}/"

done | tee $TFBS_URLS


rm -rf peakfiles

mkdir peakfiles

cd peakfiles


for URL in `cat ../$TFBS_URLS | tr '+' '/'`

do

wget $URL

done
Generate the gene sets file in gmt format
Now we will intersect the TFBS peaks with promoters. You can download a promoter bed file using the UCSC table browser. Just ensure that you're dealing with the same genome build as the one describing the TFBS data (hg19). Execute the following script, specifying the promoter/TSS bed file. It will generate a gmt containing a gene set for each TFBS peak file.
#!/bin/bash


PKDIR=peakfiles

TSSBED=Homo_sapiens.GRCh37.75_1kbTSS.bed

OUTGMT=ENCODE_TFBS.gmt


for PK in ${PKDIR}/*gz

do

BASE=`basename $PK`

zcat $PK | sort -k7gr | sed 's/^chr//' \
| intersectBed -wb -a - -b $TSSBED \
| awk '{print $NF}' | cut -d '@' -f2 \| awk '!arr[$1]++' | cut -d '_' -f2- \| awk '!arr[$1]++' | head -1000 \| tr '\n' '\t' | sed 's/$/\n/' \| sed "s/^/${BASE}\tNA\t/"
done | tee $OUTGMT
Run GSEA with the new TFBS gene sets gmt
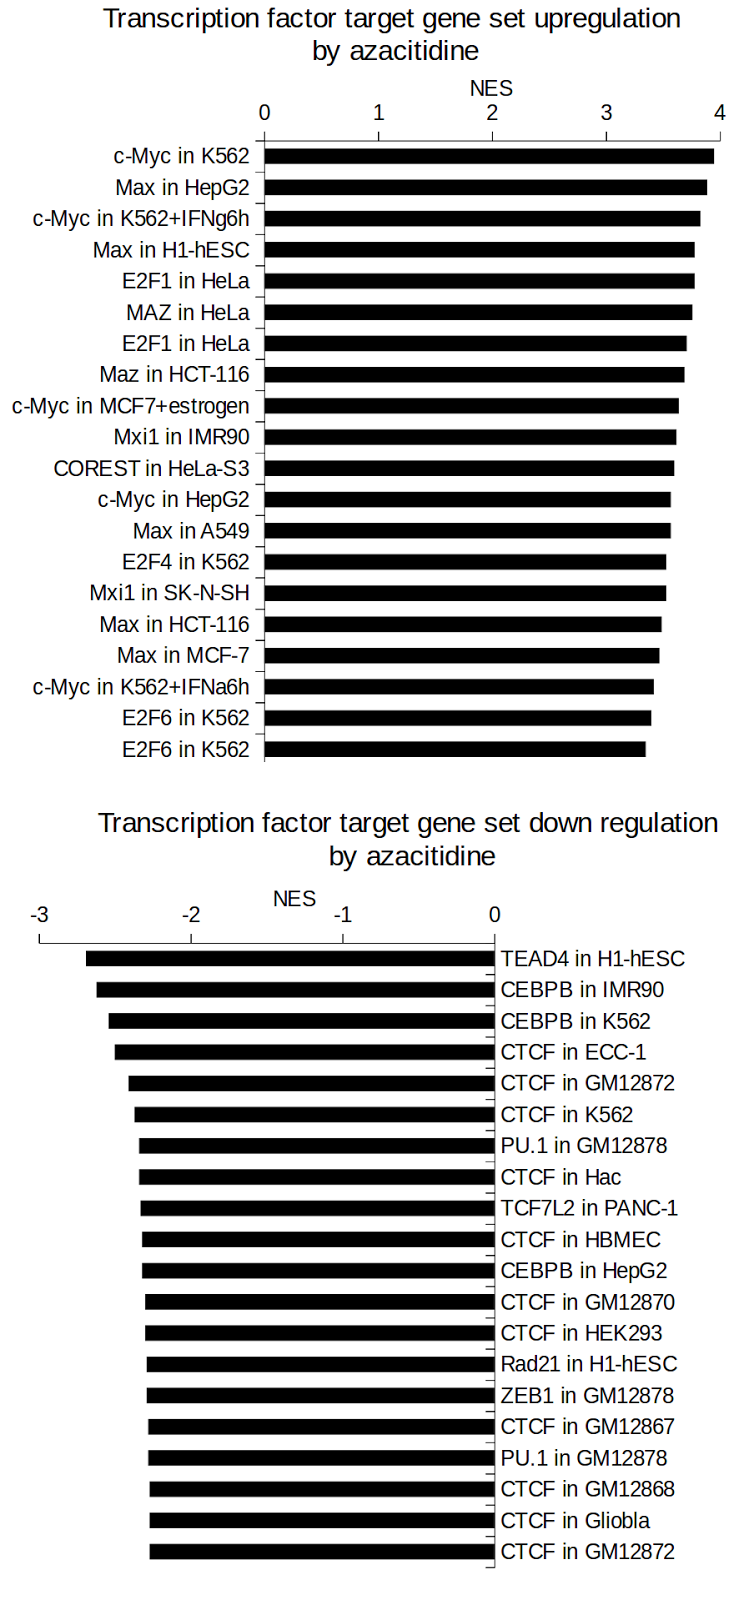
Follow instructions in the previous post to run GSEA using the java GUI. We began with 1340 gene sets and 7 were filtered out due to there being too few detected members, leaving 1333 sets for analysis. From these, 544 were up-regulated (FDR p-value≤0.05) and 261 were down-regulated.
The results show that targets of c-Myc, Max and E2F1 are up-regulated, while TEAD4, CEBPB and CTCF targets are down-regulated. This type of analysis allows researchers to perform functional assays to target the above transcription factors to elucidate and validate molecular mechanisms with clear endpoints - the differential expression of target genes in response to azacitidine.
 |
| ENCODE TFBS GSEA result of azacitidine exposed AML3 cells by RNA-seq. Top 20 gene sets in either direction are shown. |
 | ||
|
This approach is not limited to TFBS, we could also look at chromatin marks such as histone modifications or DNA methylation datasets from ENCODE or other sources.
