Quality control of sequence datasets
Before investing a lot of time in analysis of a sequencing run, it is ALWAYS a good idea to ensure that your sequence data quality is up to scratch. If you have a high proportion of low quality bases in your dataset, you're likely to have many spurious alignments. These can cause problems for virtually all NGS applications from mRNA-seq through to SNP detection and de novo assembly.
There are two main types of QC analysis for sequencing runs. The first type, which only describes the quality of the fastq file, and the second type, which describes the quality of the alignment (sam/bam file format). Lets begin with the simple fastq file analysis and we'll cover the alignment QC at a later stage.
The fastq file format has become the standard raw data format for high throughput sequence datasets. Each base is given a Phred quality score represented as an ASCII character. The higher the Qscore, the more confidence you can have in the identity of the base. But there are other things to watch out for, self-ligated adaptor contamination, sequence duplication levels (low diversity), GC content bias, over/under-representation of certain motifs (k-mers) and presence of other artifacts.
For this type of analysis, there are a growing number of software options available and I'll go through just a few.
Check out the PLoS One paper for all the features. Here is an example of analysing single-end Illumina sequence datasets on one processor.
"-se" stipulates single-end data set
"1" stipulates the primer/adaptor library used (1 = Genomic DNA/Chip-seq Library)
"A" stipulates automatic detection of the fastq type (either fastq illumina or fastq sanger)
Running in parallel, one can try the following:
This is a suite of python scripts, making them fairly easy to install (on Linux) once you have python, R, gcc and numpy installed. Following the install documentation is fairly easy and there is a comprehensive online manual. RSeqQC provides a few handy tools for analysis of quality scores, nucleotide frequency, duplication frequency and GC distribution. Most of the scripts, such as read_quality.py require an input sam/bam file, so a conversion is necessary before analysis. Have a look at the paper on RSeqQC published in Bioinformatics.
Here is an example of running RSeqQC for a bam file:
Have you used another sequence QC program? Let us know your thoughts.
There are two main types of QC analysis for sequencing runs. The first type, which only describes the quality of the fastq file, and the second type, which describes the quality of the alignment (sam/bam file format). Lets begin with the simple fastq file analysis and we'll cover the alignment QC at a later stage.
The fastq file format has become the standard raw data format for high throughput sequence datasets. Each base is given a Phred quality score represented as an ASCII character. The higher the Qscore, the more confidence you can have in the identity of the base. But there are other things to watch out for, self-ligated adaptor contamination, sequence duplication levels (low diversity), GC content bias, over/under-representation of certain motifs (k-mers) and presence of other artifacts.
For this type of analysis, there are a growing number of software options available and I'll go through just a few.
Fastx_quality_stats
Part of the popular Fastx toolkit, Fastx quality stats script, gives an overview of the quality scores on a cycle-by-cycle basis. This is a really quick way to look at the general quality scores for a dataset, before proceeding with alignment. It provides these useful stats:It also gives a count of each type of base called at each cycle. Version 0.0.13 also provides separate statistics sets for each of the four bases. One drawback of this package is that you don't get to see quality scores by location. For instance you won't be able to detect whether certain tiles on the flow cell are problematic. Fastx toolkit is designed to be run on the command line and is also commonly run from the Galaxy GUI (visit galaxyproject.org for further info). The command line scripts require installation of a few dependencies which can be tricky, but worthwhile. Here is an example of running the fastx_quality_stats for a example file called "dataset.txt". The stats output will be saved to a file "dataset_Qstats.txt".mean = Mean quality score value for this cycleQ1 = 1st quartile quality scoremed = Median quality scoreQ3 = 3rd quartile quality scoreIQR = Inter-Quartile range (Q3-Q1)
fastx_quality_stats -i dataset.txt -o dataset_Qstats.txtThe fastx toolkit has a bunch of other scripts for performing quality trimming and adapter clipping which are extremely useful.
SolexaQA
Based in perl, SolexaQA is another option for quality analysis and read trimming. Its functionality is similar to Fastx toolkit, but provides quality-per-tile based statistics on top of the quality-per-cycle function. Installation is as easy as unzipping the perl scripts from the download page and following the installation instructions. One thing I really like, it that it can sub-sample the data sets to get a very quick impression of the quality across tiles and cycles. If you want the graphical outputs, there might be some hassles in getting the dependencies installed, but the finished product is worth it in my view. |
| Example output from SolexaQA |
Check out the paper in BMC Bioinformatics.
Example running the SolexaQA script:
perl SolexaQA.pl dataset.txt
NGS QC Toolkit
Is a suite of perl scripts which are run on the command line using Linux or Windows. Like Fastx toolkit, it requires some installation of dependencies. When you do get it running, you get the benefit of parallelisation - running one job over as many processors as you have - a major advantage if you're working with huge data sets on large computing cluster. The IlluQC.pl script produces quality measures on a per-cycle basis like Fastx toolkit, but also provides GC content distribution profile, quality score distribution and gives an indication of how many adapter reads are present. Documentation is fairly good and the authors provide plenty of example commands which I found helpful. Per-cycle quality for two Illumina datasets. |
Check out the PLoS One paper for all the features. Here is an example of analysing single-end Illumina sequence datasets on one processor.
perl IlluQC.pl -se dataset.txt 1 A
"-se" stipulates single-end data set
"1" stipulates the primer/adaptor library used (1 = Genomic DNA/Chip-seq Library)
"A" stipulates automatic detection of the fastq type (either fastq illumina or fastq sanger)
perl IlluQC_PRLL.pl -c 20 -se dataset.txt 1 A
"-c" denotes the number of parallel processors to use
FastQC
Running in Java, FastQC can run in interactive mode for a few datasets or non-interactive for when you want to process a whole directory of files. It provides many of the metrics defined in the NGS QC toolkit such as per-cycle quality stats and %GC distribution, but also detects highly duplicated sequences and motifs/k-mers which could originate from library contamination or self-ligated adapter carry-over. FastQC has been adopted by many users on Galaxy and can be found in the Galaxy Toolshed.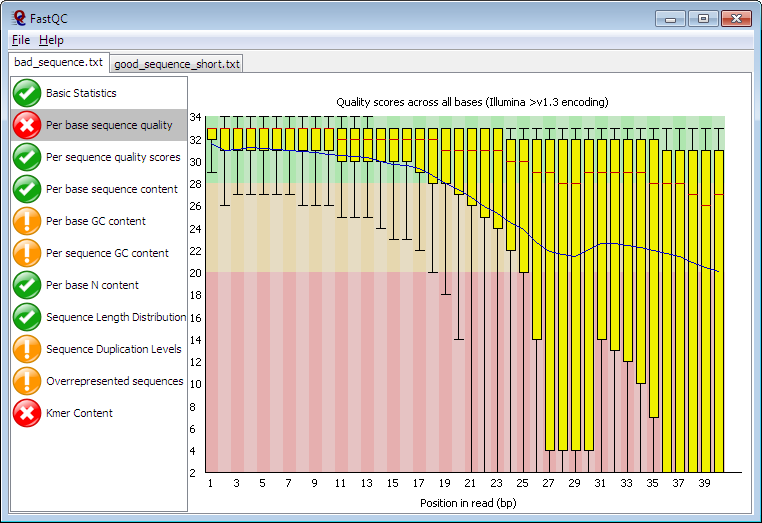 |
| Example of a per-cycle quality profile using FastQC |
As for usability, it runs in Java so should run on all common operating systems once you have Java Runtime Environment (JRE) installed. The installation documentation is very good and the authors even have a video tutorial. You can run it non-interactively by entering the following on the Unix command line when you are in a directory of sequence files. Here is an example for a single fastq file:
perl fastqc dataset.txtor for a range of files:
perl fastqc dataset[1-10].txt
SeqQC
Running on Windows and Linux, SeqQC is a command line tool which does the basics (per-cycle quality, nucleotide distribution) and goes the extra mile, detecting adapter sequences, over-represented motifs/k-mers, and low complexity repeats. You need to register to get the download link and need to enter a password to unzip the file which is completely unnecessary in my view. On Linux, the executable opens an interactive command line which is probably nice for newbies, but I found it a bit clunky as I'm used to running non-interactive pipelines. |
| Example SeqQC outputs. |
 |
| Example of quality analysis result of RNA-seq by RSeqQC. |
read_quality.py -i example.bam -o output
TileQC
Relatively few tools are able to analyse quality in terms of location of a read on an Illumina flowcell. TileQC can identify specific issues such as bubbles, flares, flowcell peeling, leaky manifolds, oil spill and bleached squares which assists in troubleshooting. It uses SQL and R to rapidly process data and produce attractive graphs like this one. While R and SQL are really powerful tools, these are also unnecessarily complicated to get running compared to the above. Luckily there's thorough documentation to guide you up the learning curve. Here is the link to the paper in BMC bioinformatics. |
| Examples of bad tiles using TileQC |
NGSQC
This suite of python based scripts is fairly unique in that it can perform quality-by-cycle and quality-by-tile/location for not just Illumina sequence data, but also Solid data. Dependencies include bowtie surprisingly. The paper was featured in BMC Bioinformatics.
 |
| Example overview of a full Solid slide run |
Picard
Picard is a suite of Java-based command line tools that have similar capability to SamTools in that it's able to view, manipulate and analyse sam and bam files. It has some useful commands for quality score analysis but these require a sam/bam file so the data needs to undergo conversion with the FastqToSam script followed by MeanQualityByCycle and QualityScoreDistribution.Summary
The QC approach you need depends very much on the type of experiment you're doing. If you're doing de novo assembly of long reads, you may need a higher stringency of quality checking than if you were doing short-read mRNA or ChIP-seq. At a very minimum, you will need to look at the quality-per-cycle metrics and presence of adapter contamination. FastQC is probably the most widespread QC suite in use today, because its not overly complicated to install or use locally or on Galaxy, is compatible with most platforms and produces graphical, intuitive outputs. I was pleasantly surprised by the comprehensive output of the NGS QC Toolkit, and having it run in parallel mode is a big win for those like me who don't want to spend all day with such mundane tasks. If you're a facility operator, it's likely that you'll need to master a combination of these, including ones which can look at quality-by-tile such as SolexaQA, TileQC or NGSQC. On the other hand, if you are a casual NGS user with a windows computer, you might find SeqQC useful.
Have you used another sequence QC program? Let us know your thoughts.

